audioMotion.js
Advanced Panel
Click Advanced in the panel selection buttons to open the Advanced Panel.

Advanced settings are listed below in alphabetical order.
Bar Spacing
The amount of spacing between analyzer bars. This setting is only effective in Bars mode.
Channel Layout
Selects single or dual channel display, with different layout options:
| Channel Layout | Description |
|---|---|
| Single | Single channel analyzer, representing the combined output of all channels (stereo or surround). |
| Comb | Dual channel analyzer, both channels overlaid. Works best with Line Graph mode or OUTLINE switch on. |
| Horiz | Dual channel, side by side - see Mirror for additional layout options. |
| Vert | Dual channel, left channel at the top half of the canvas and right channel at the bottom. |
The channel layout does NOT affect stereo audio output.
?> Surround audio output is currently only supported with Single channel layout, and must be enabled in Configuration > General settings.
FFT Size
Number of samples used for the Fast Fourier Transform performed by the analyzer.
Higher values provide greater detail in the frequency domain (especially for low frequencies), but less detail in the time domain (slower response to changes). The default value of 8192 usually provides the best cost/benefit ratio for both domains.
FFT Smoothing
Averaging factor used to smooth FFT data between analysis frames.
Lower values make the analyzer react faster to changes, and may look better with faster tempo songs and/or larger FFT sizes. Increase it if the analyzer animation looks too “jumpy”.
Fill Opacity
Transparency of the graph area or bar fill. The ALPHA switch, when active, has precedence over the Fill Opacity (for Bars mode only).
Effective only for Graph analyzer mode or when OUTLINE switch is on.
!> On Firefox, Fill Opacity may not work properly with Radial analyzer, due to this bug.
Frequency Range
The lowest and highest frequencies represented in the spectrum analyzer. You can use this feature to “zoom in” a specific frequency range.
Frequency Scale
| Scale | Frequency distribution preview |
|---|---|
| Bark |  |
| Linear |  |
| Log |  |
| Mel |  |
The logarithmic scale allows proper visualization of octave bands (see Band Count).
Bark and Mel are perceptual pitch scales, which provide better visualization of mid-range and high frequencies, when compared to log or linear scales.
Import / Export Settings
Click Export to download all current settings in the Settings and Advanced panels as a JSON file. Use it to share and store backup copies of your settings.
Click Import to load settings from an external JSON file. Please note that this will overwrite all current settings in both the Settings and Advanced panels.
You can also import downloaded presets this way.
Level Scale
Switch between Decibels and Linear scale to represent audio levels in the frequency spectrum.
Line Width
Thickness of the Graph line or OUTLINE stroke.
Mirror
Selects whether the analyzer graphics should be mirrored to the left (low frequencies at the center) or to the right (high frequencies at the center).
When Channel Layout is set to Horiz, this setting modifies the direction of the left or right channels.
| Mirror: Left | Mirror: Right |
|---|---|
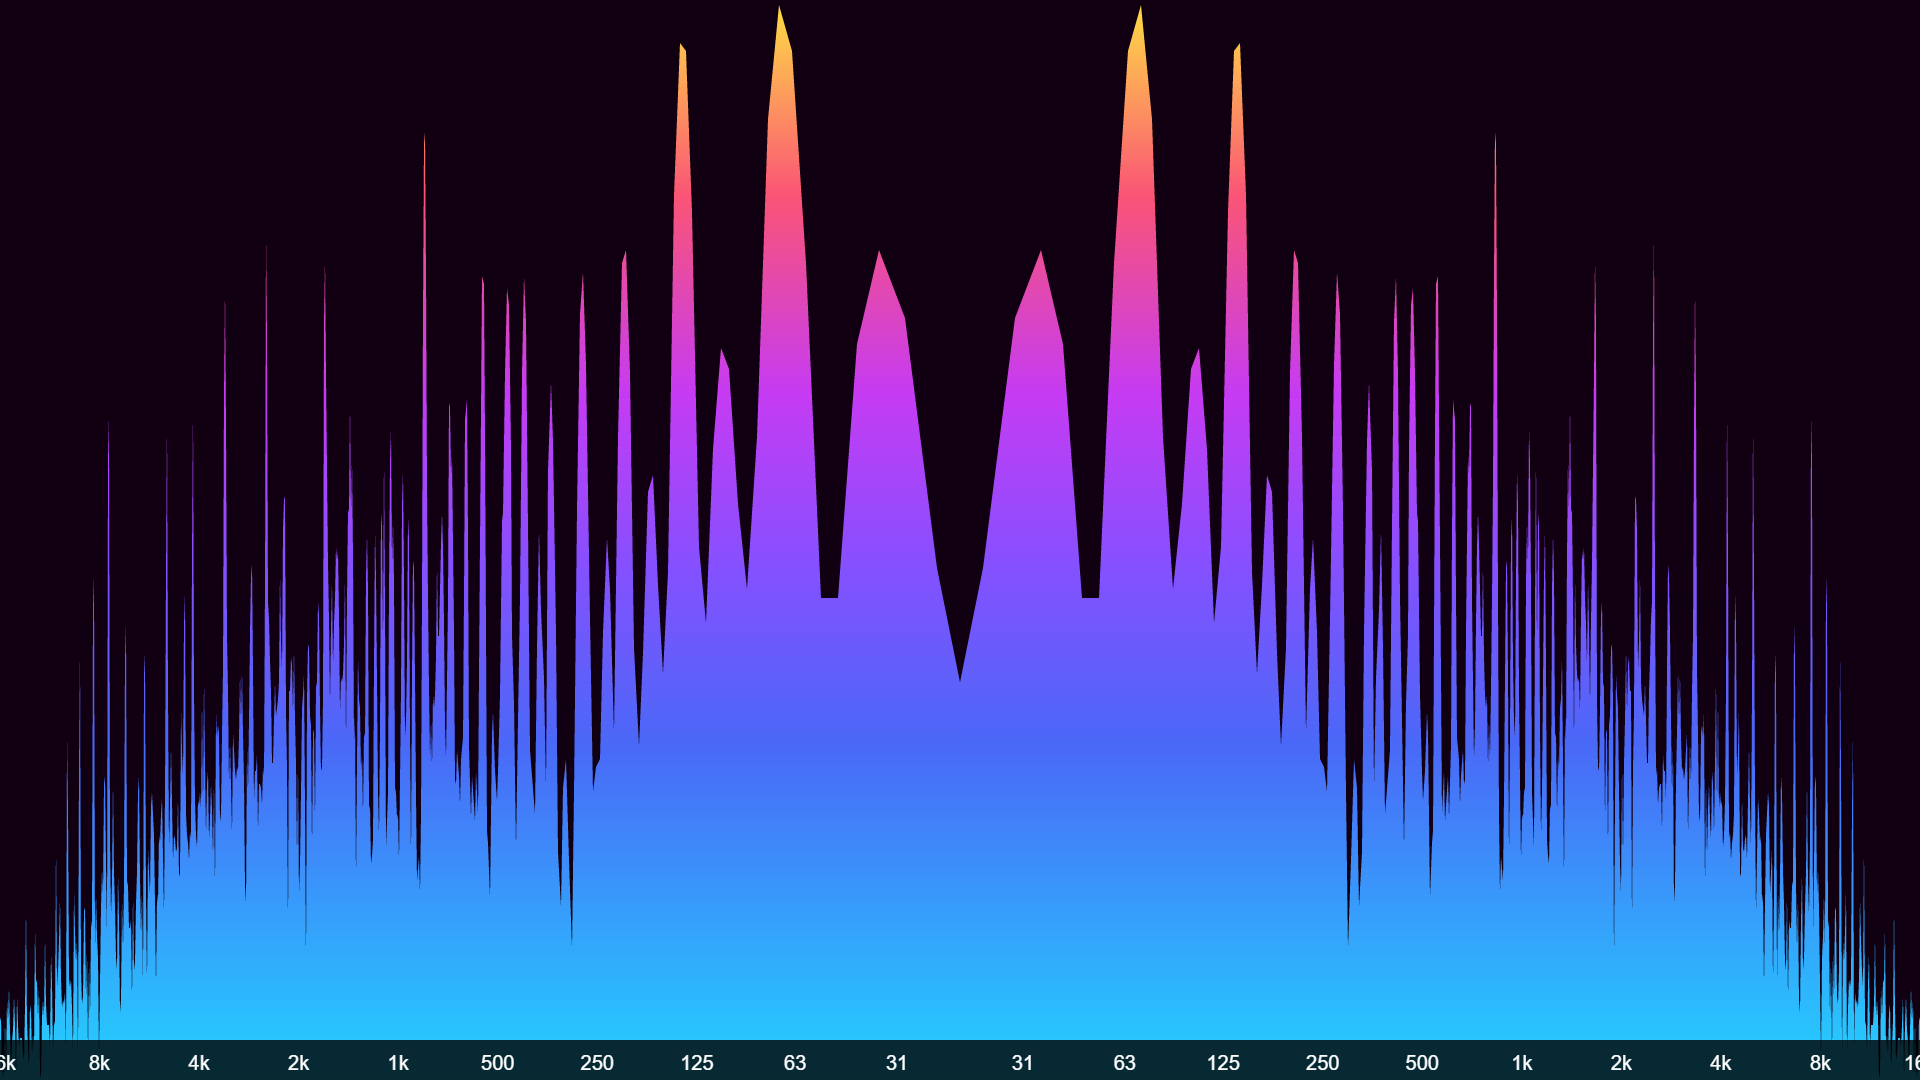 |
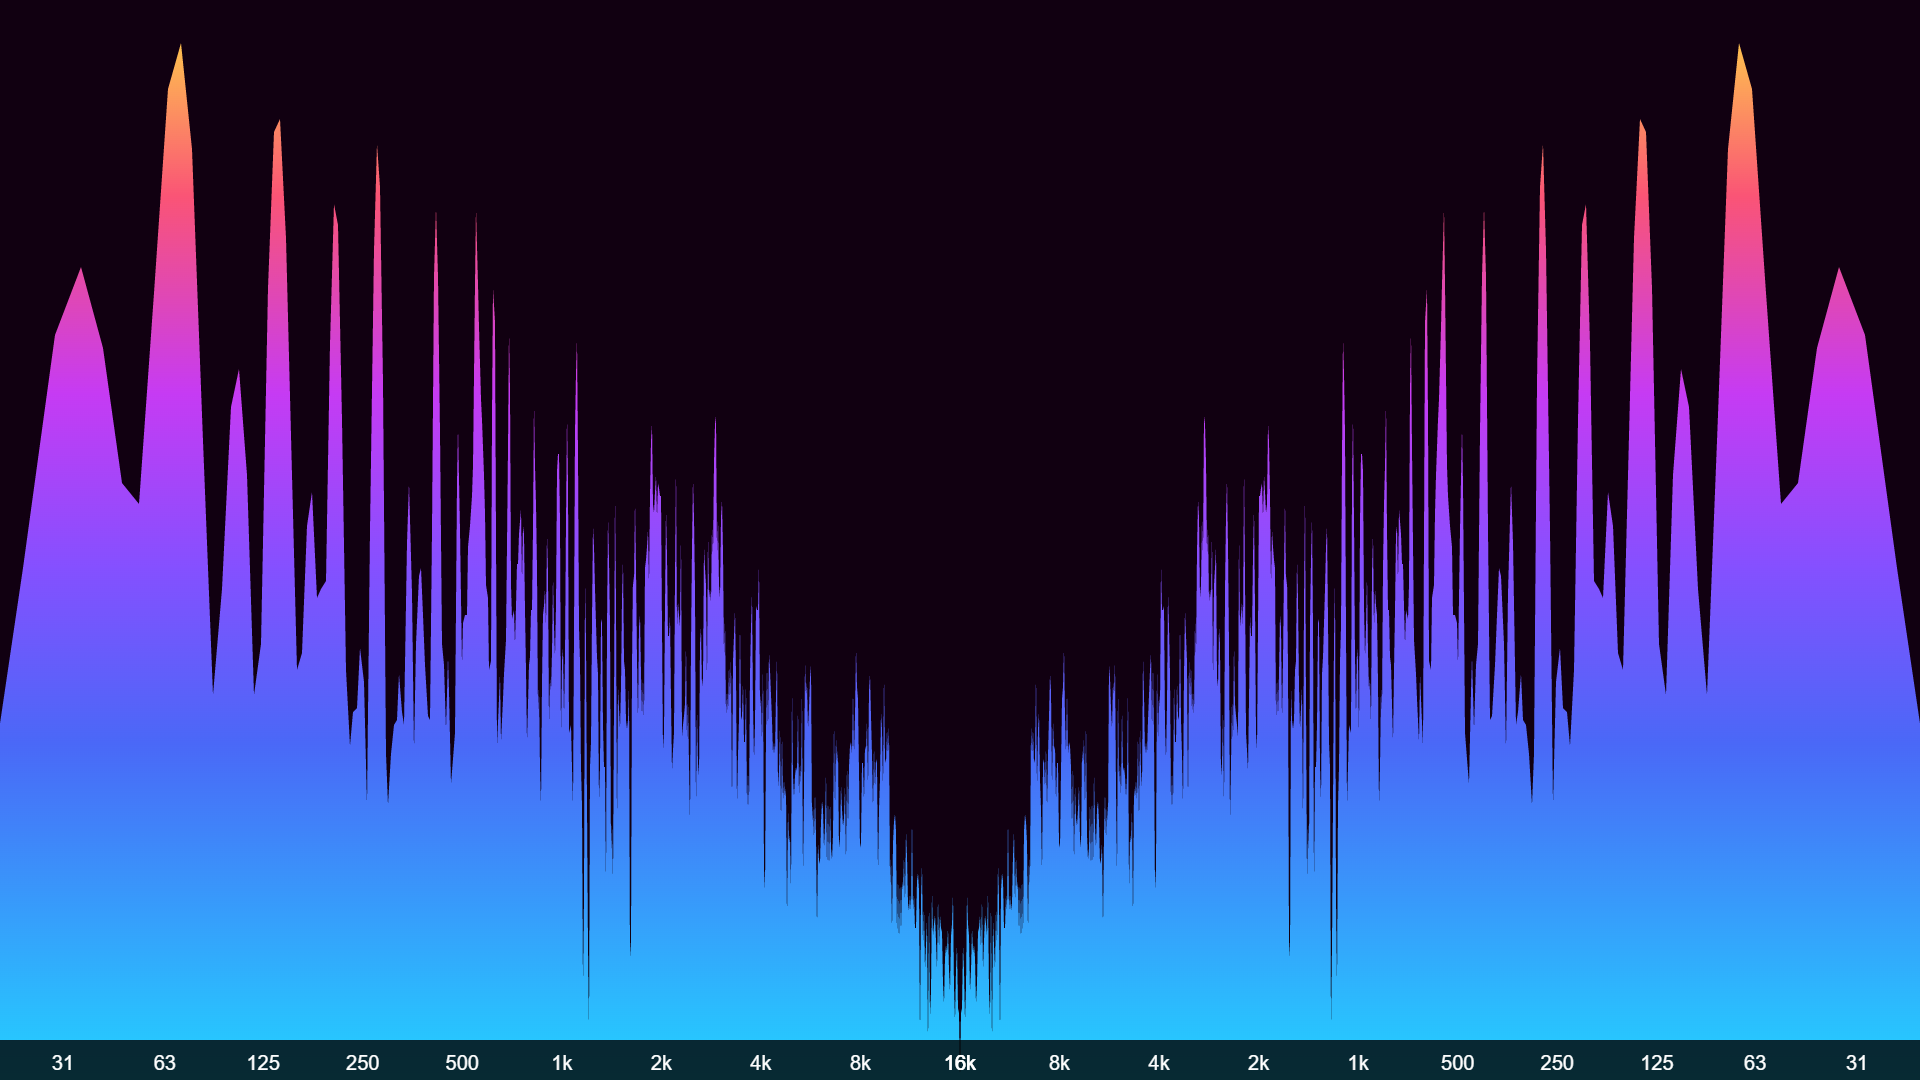 |
Octave Bands
Switch between using the ANSI/IEC preferred frequencies or the equal-tempered scale to compute center and edge frequencies of octave bands.
When Frequency Scale is set to Log this will also reflect in the frequency labels displayed in the X-axis, representing the center frequencies of each octave.
| Octave Bands | Octaves center frequencies |
|---|---|
| Tempered |  |
| ANSI/IEC | |
Radial Size
Configure the radius of the radial analyzer, when RADIAL switch is on.
Radial Spin
Configure the radial analyzer spinning speed and direction, when RADIAL switch is on.
Weighting Filter
Weighting filter applied to frequency data for spectrum visualization.
Each filter applies a unique gain/attenuation curve to specific frequency ranges, as shown in the graph below, helping to highlight sounds the human ear is more or less sensitive to.
Enabling filters may impact analyzer performance, due to increased real-time data processing.
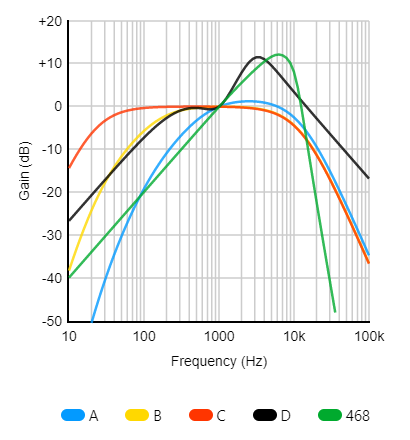
?> Weighting filters affect only the visualization data, NOT the audio output.